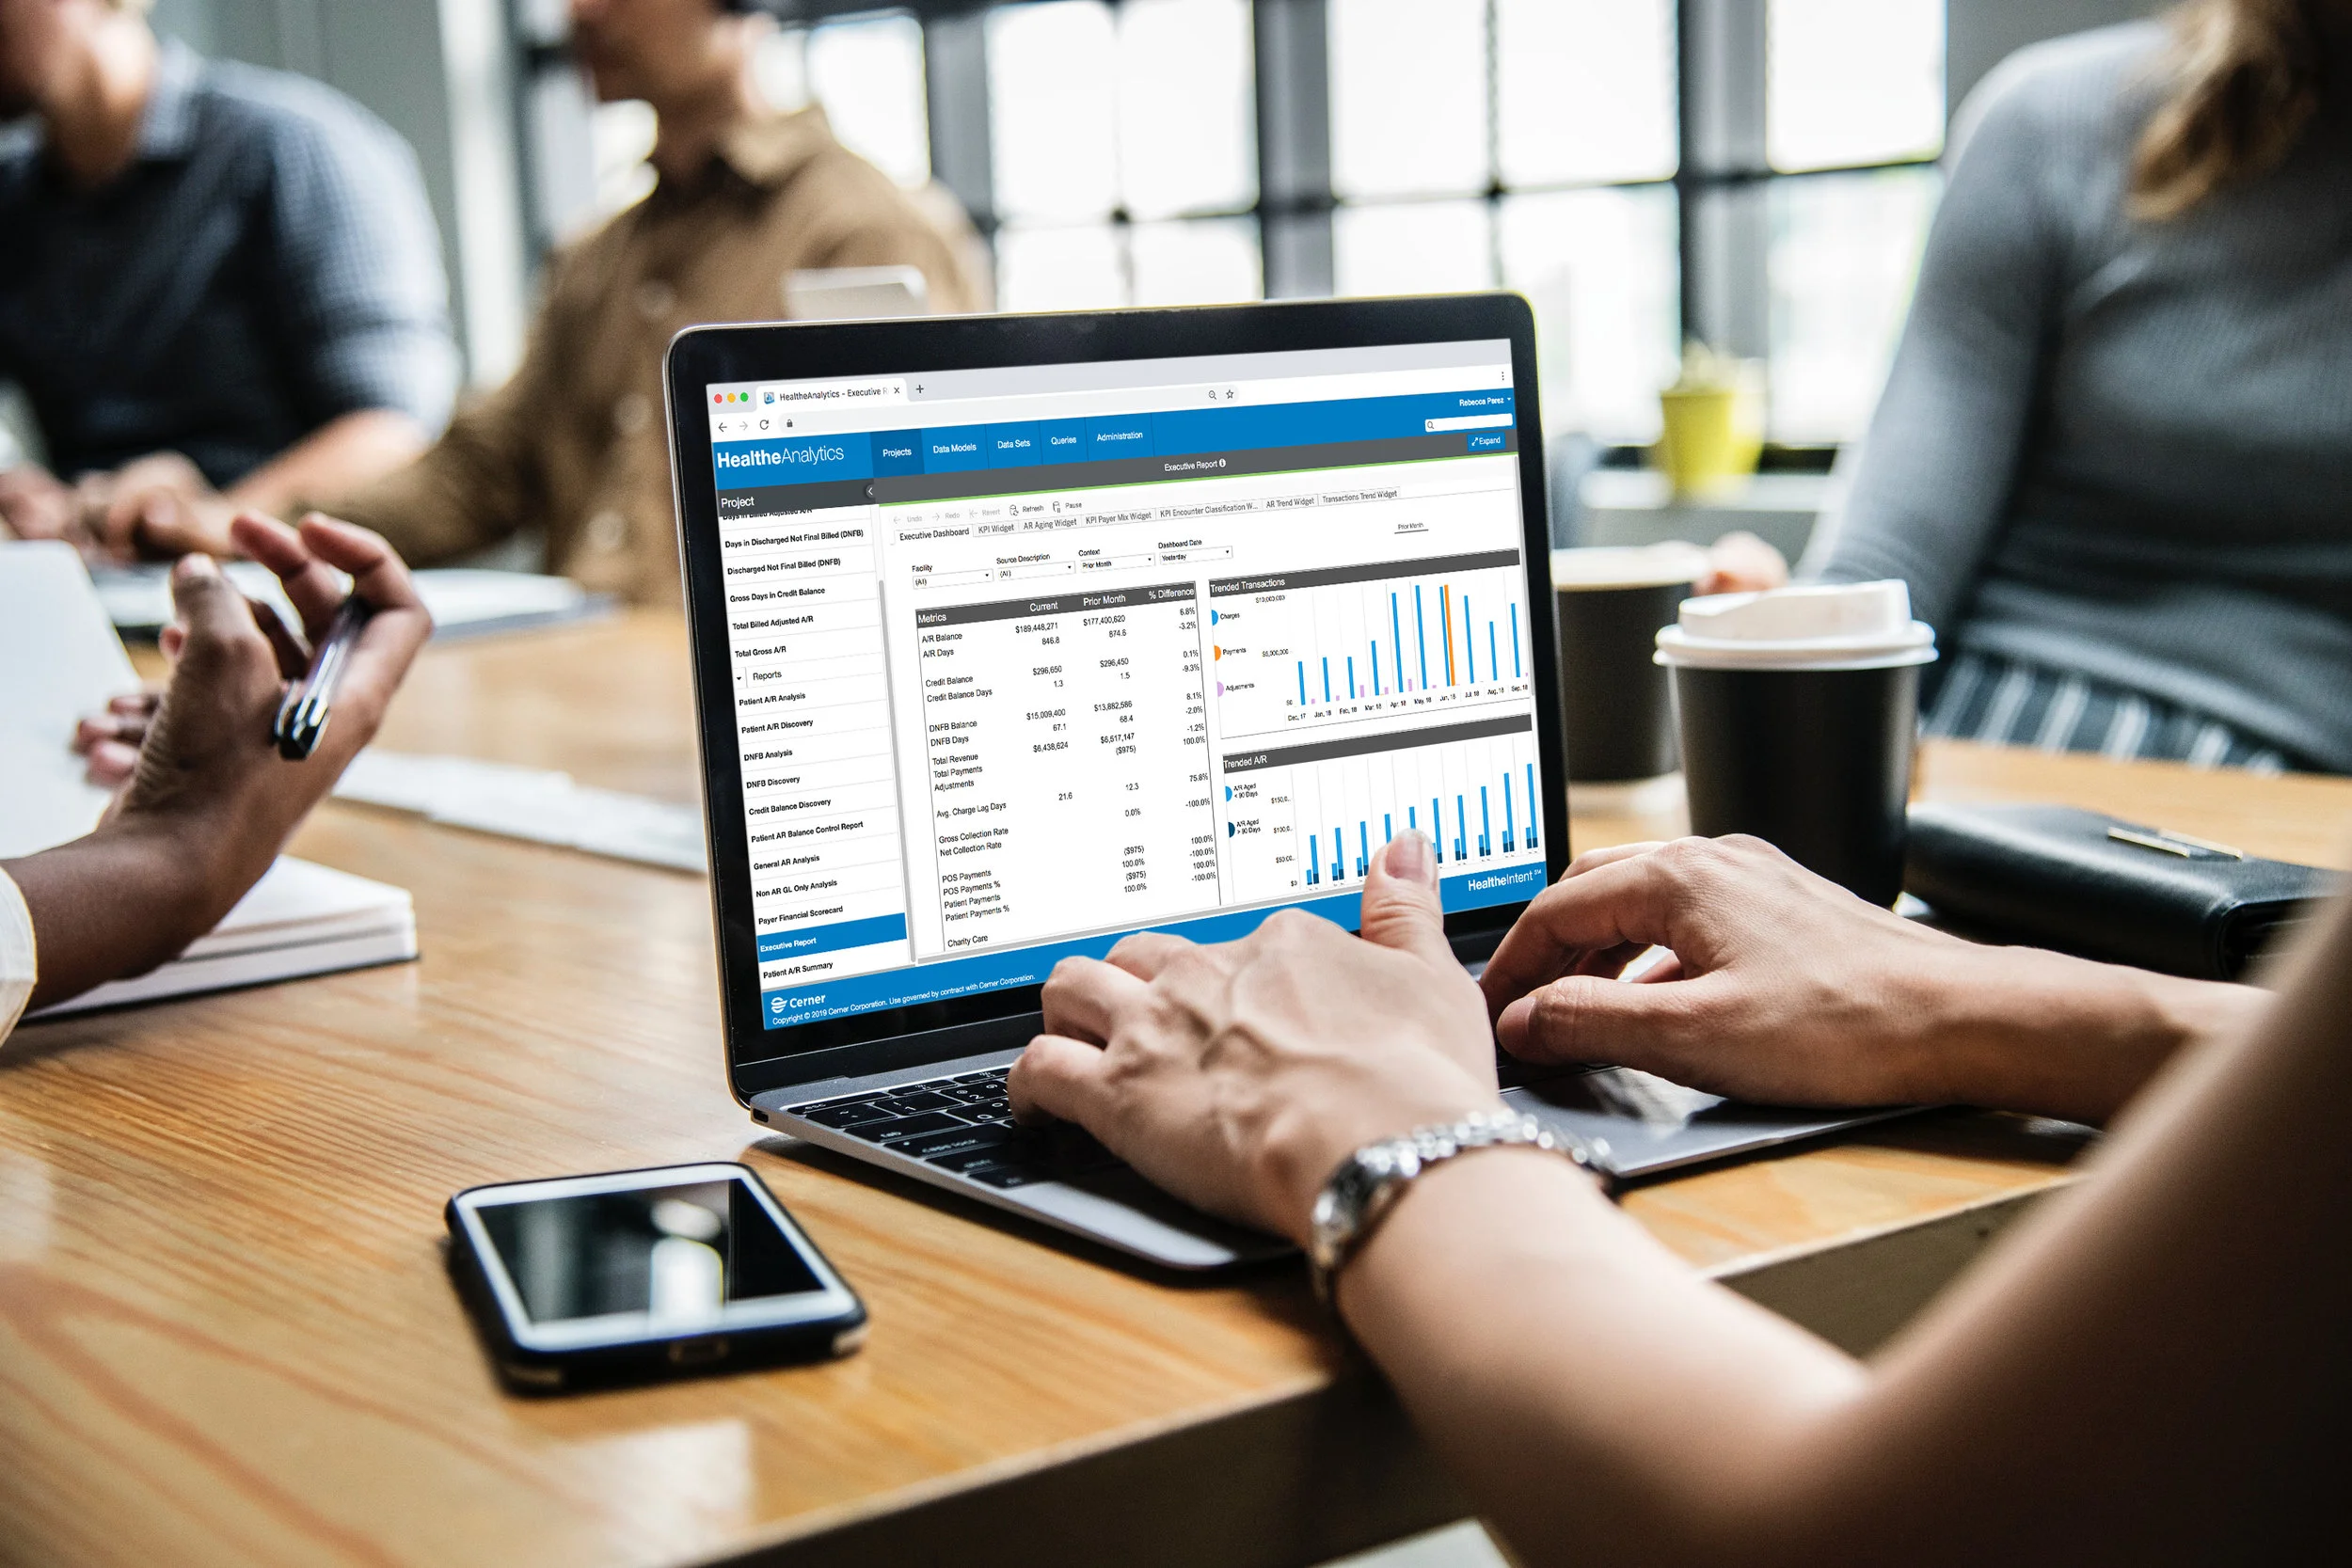
HealtheEDW (Electronic Data Warehouse) was developed for Data Stewarts and Analysts enabling access to a variety of data and ways to manipulate it. These data roles utilized the application to conduct data transformations and produce analytic visualizations. Data discovery from this application often assist in process improvement projects such as reducing readmission rates or increasing revenue billing
the problem
Data Stewarts hold very important positions in an organization. They are essentially the gate keepers of an organizations data. Other business users, such as Business Analysts, Directors, and Executives need to work with the Data Stewart to ensure that they have access to what they need for report generation, project direction, or request response. To do this Data Stewarts utilize SQL (a programming language used to manage data) to build easy-to-use data models; surfacing them for their requesters. They need an all-in-one application that can help them achieve these goals.
The Project breakdown
My Role: Designer
The Team: 1 Designer | 1 Researcher
Time Frame: 8 Months
Lean ux
This product team was in a time crunch for getting this new application developed. They only had 8 months for what was originally scoped as a 1 1/2 year project - so they need to move quickly. After some research, we all decided to try a Lean UX model of work. At the time the UX group had not had the opportunity to try the methods of build, measure, and learn - this would be the first time on our platform.
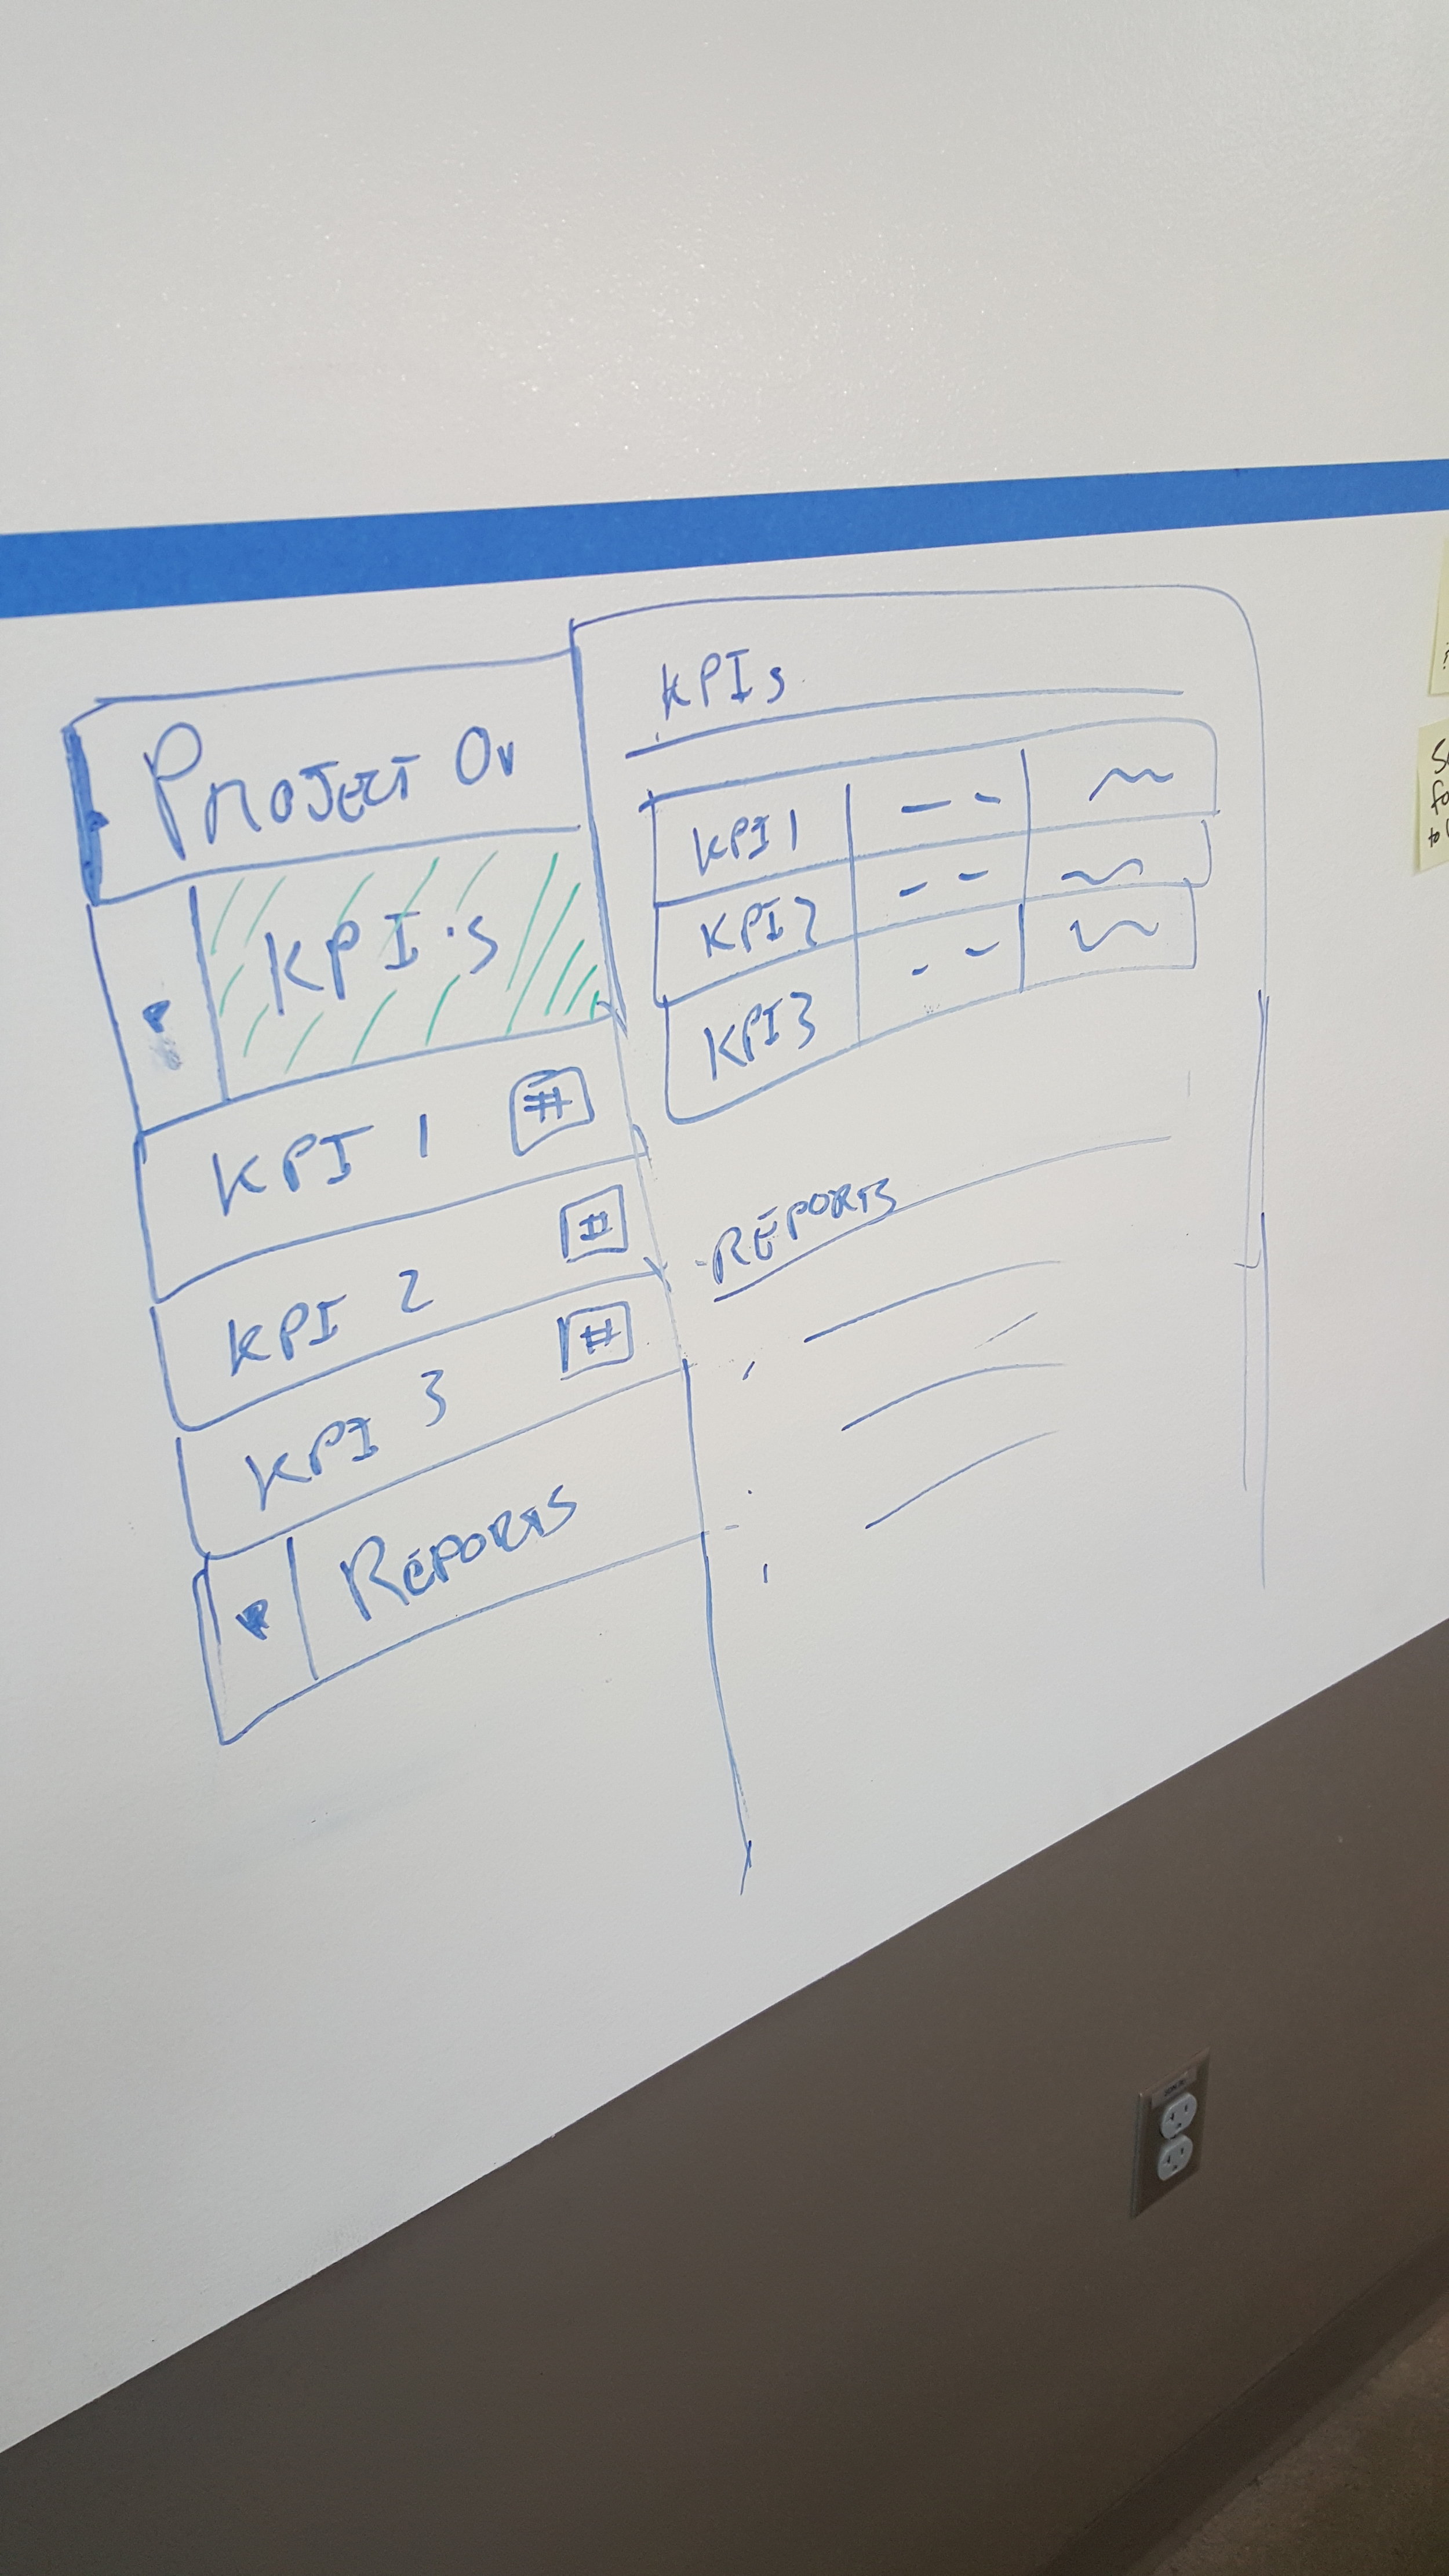
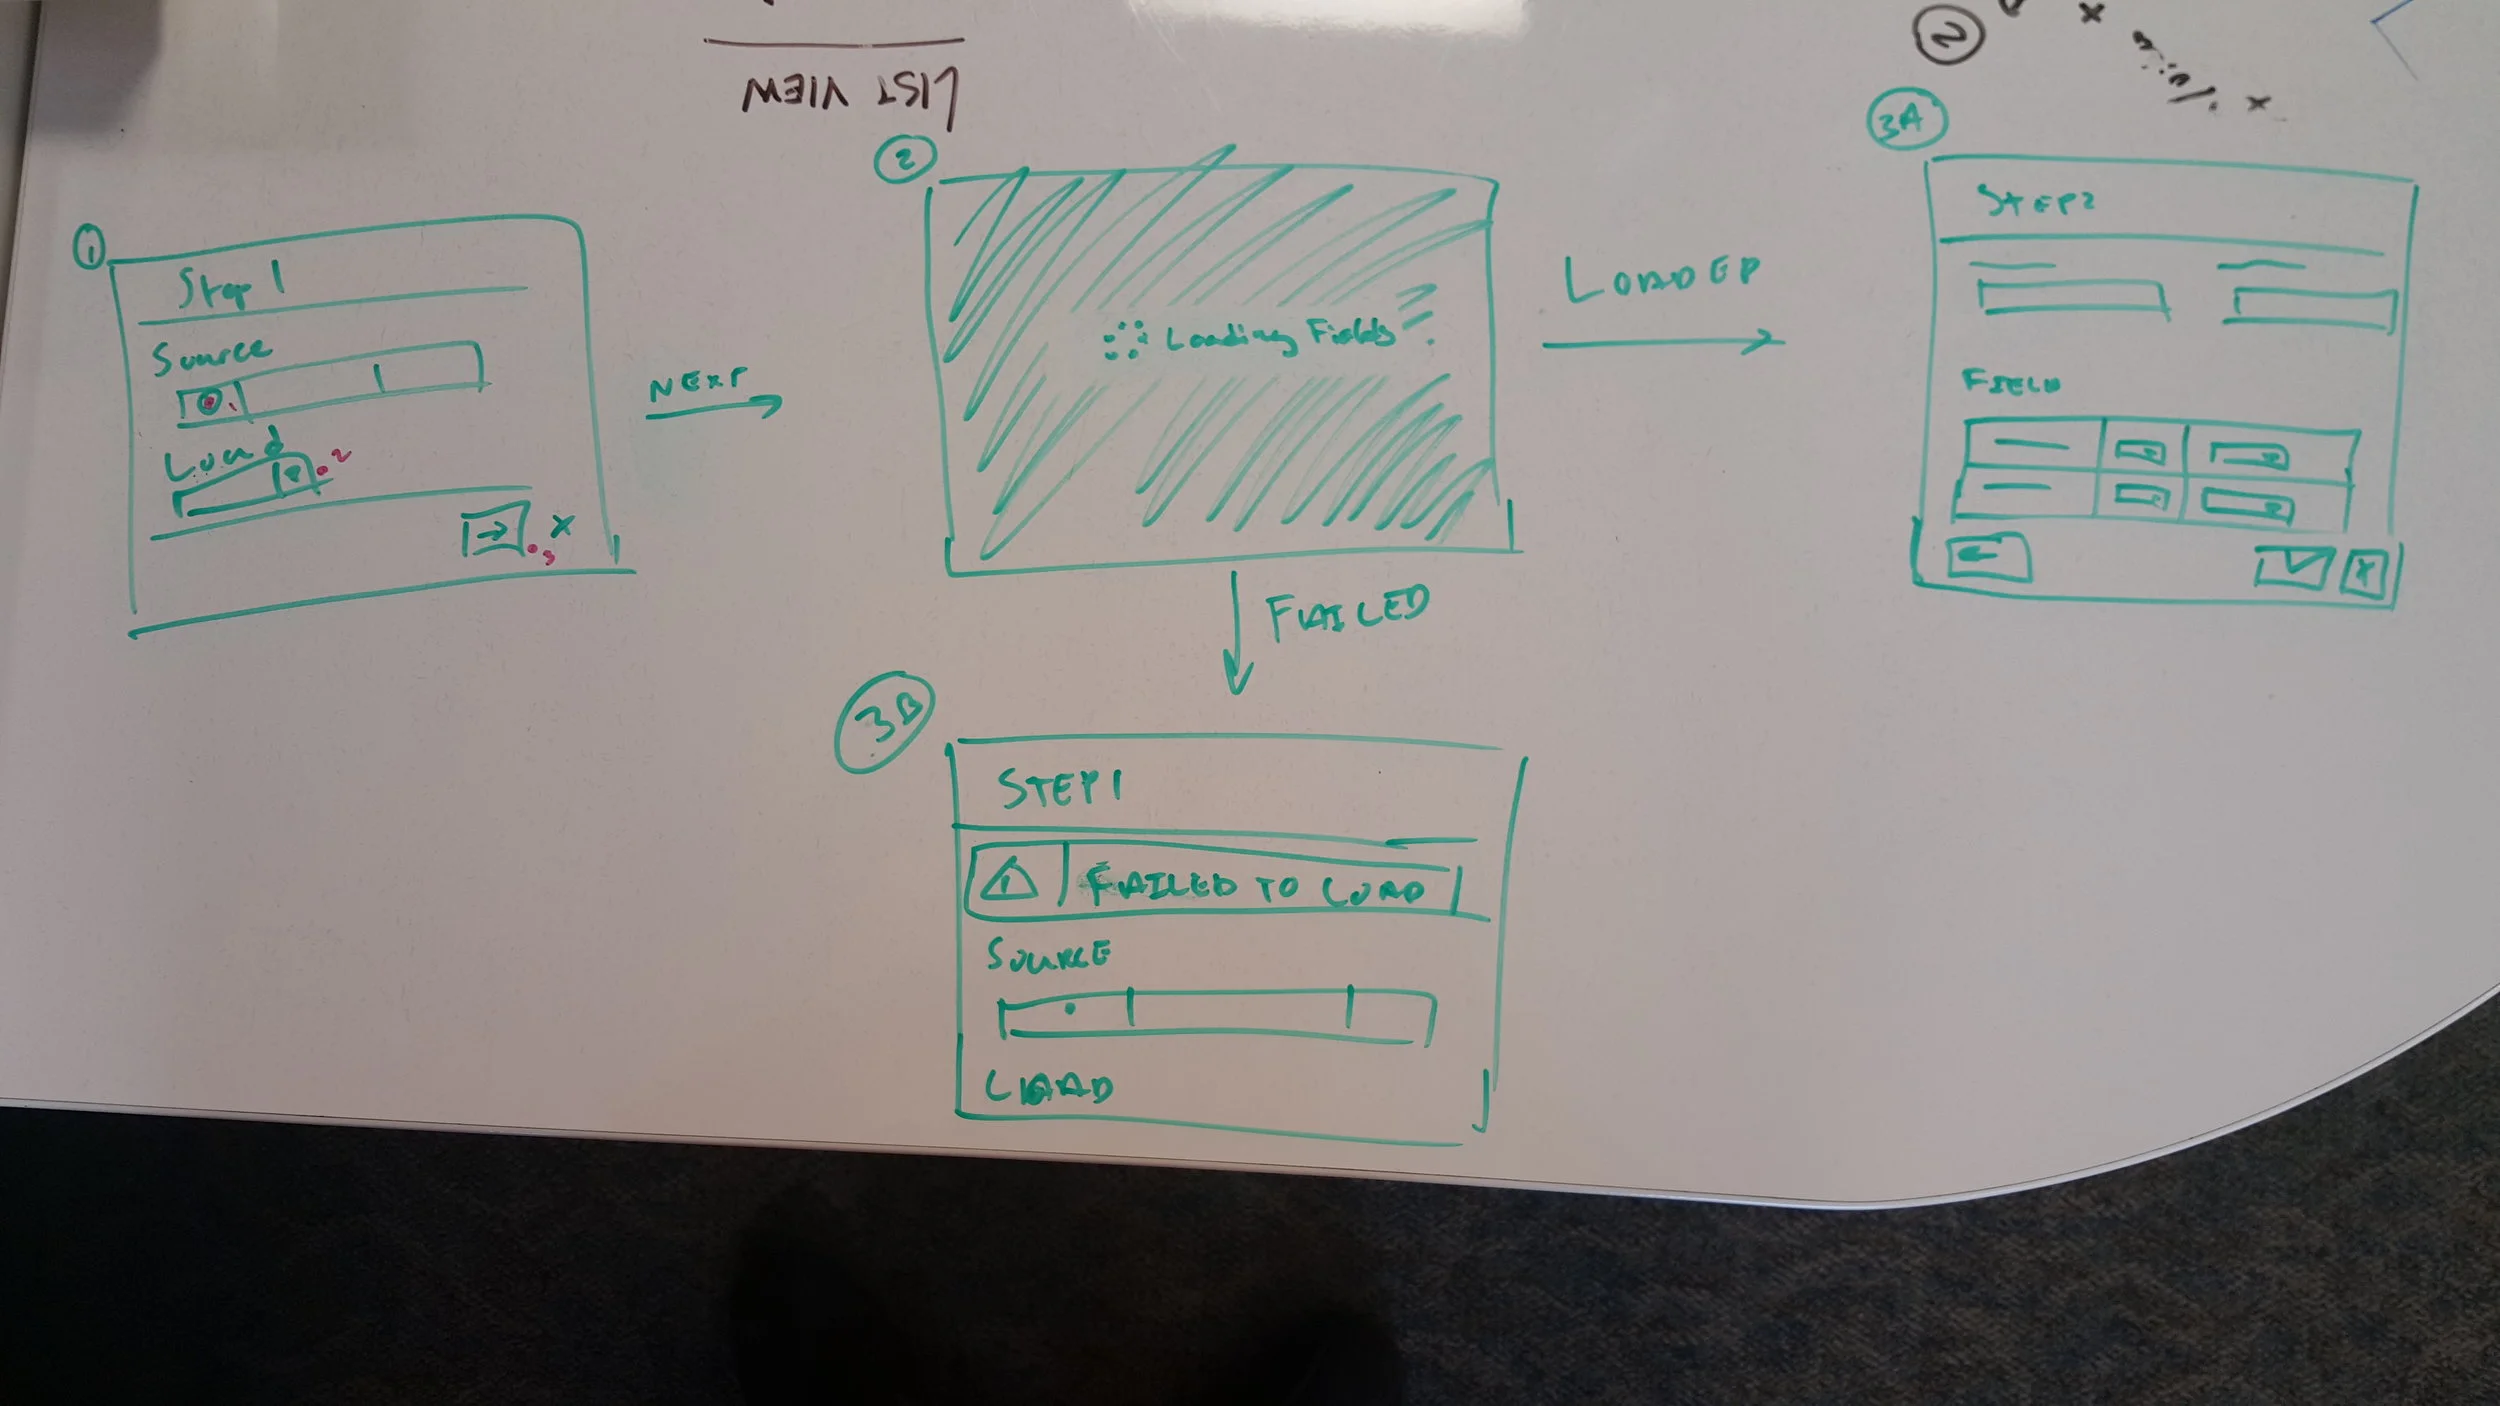
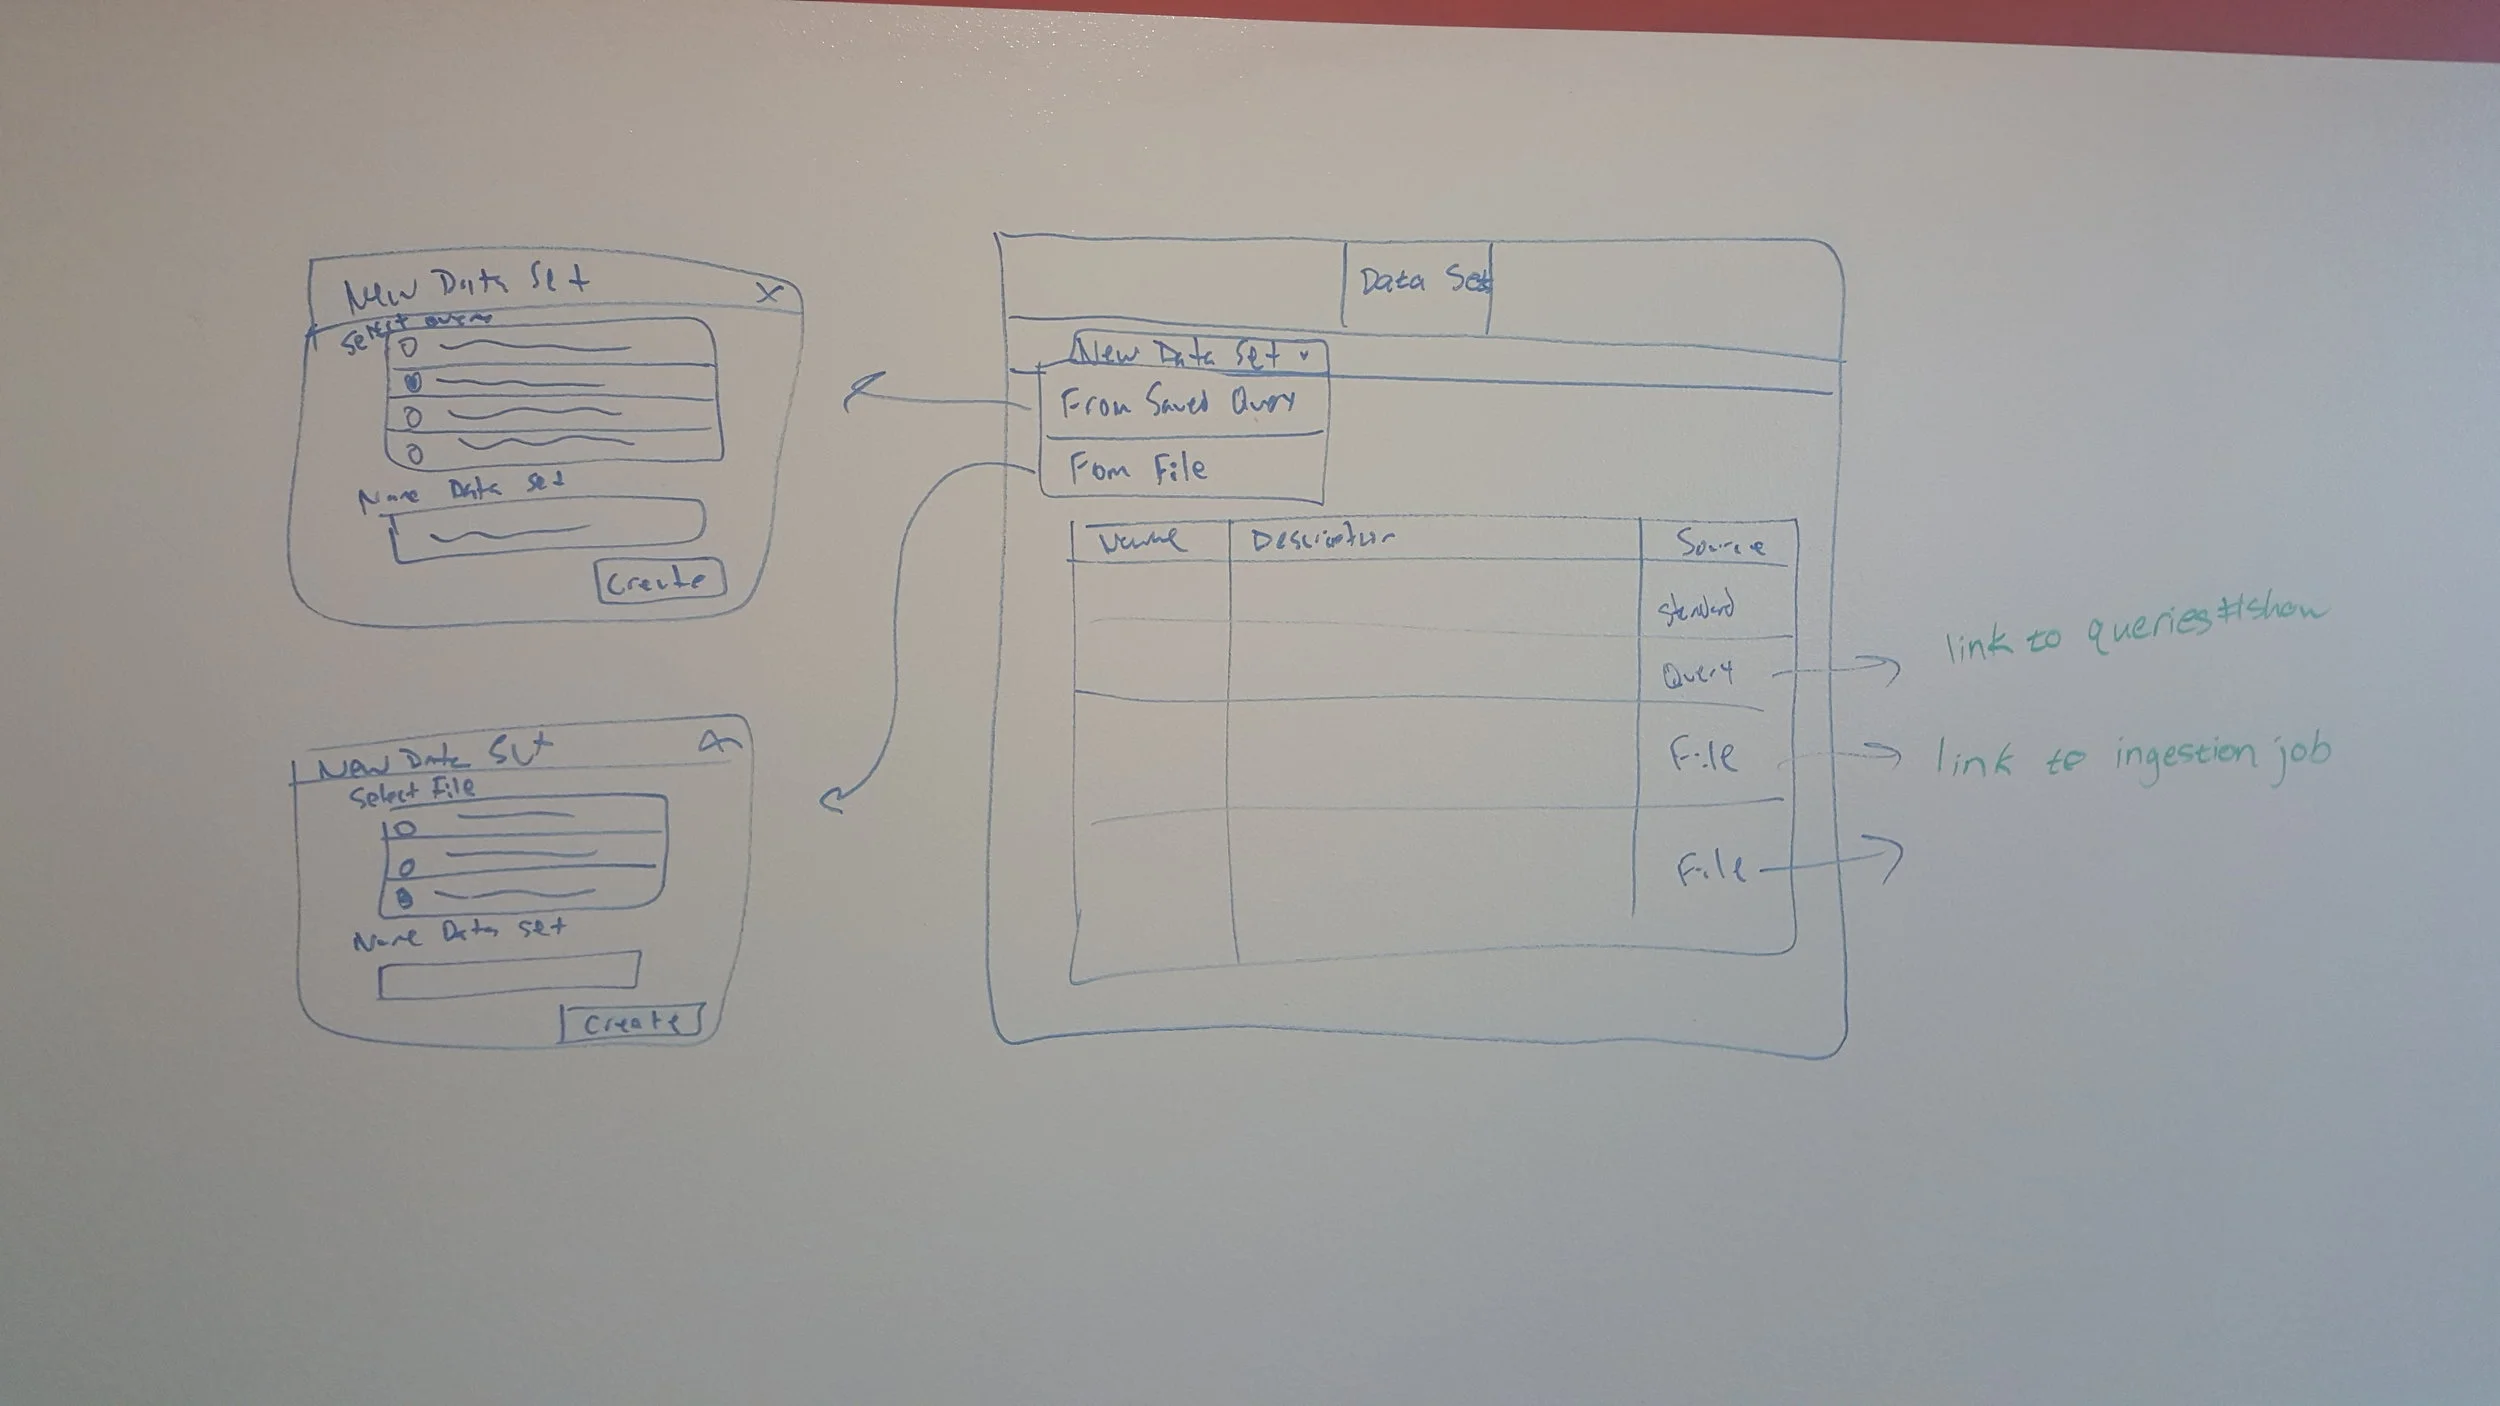
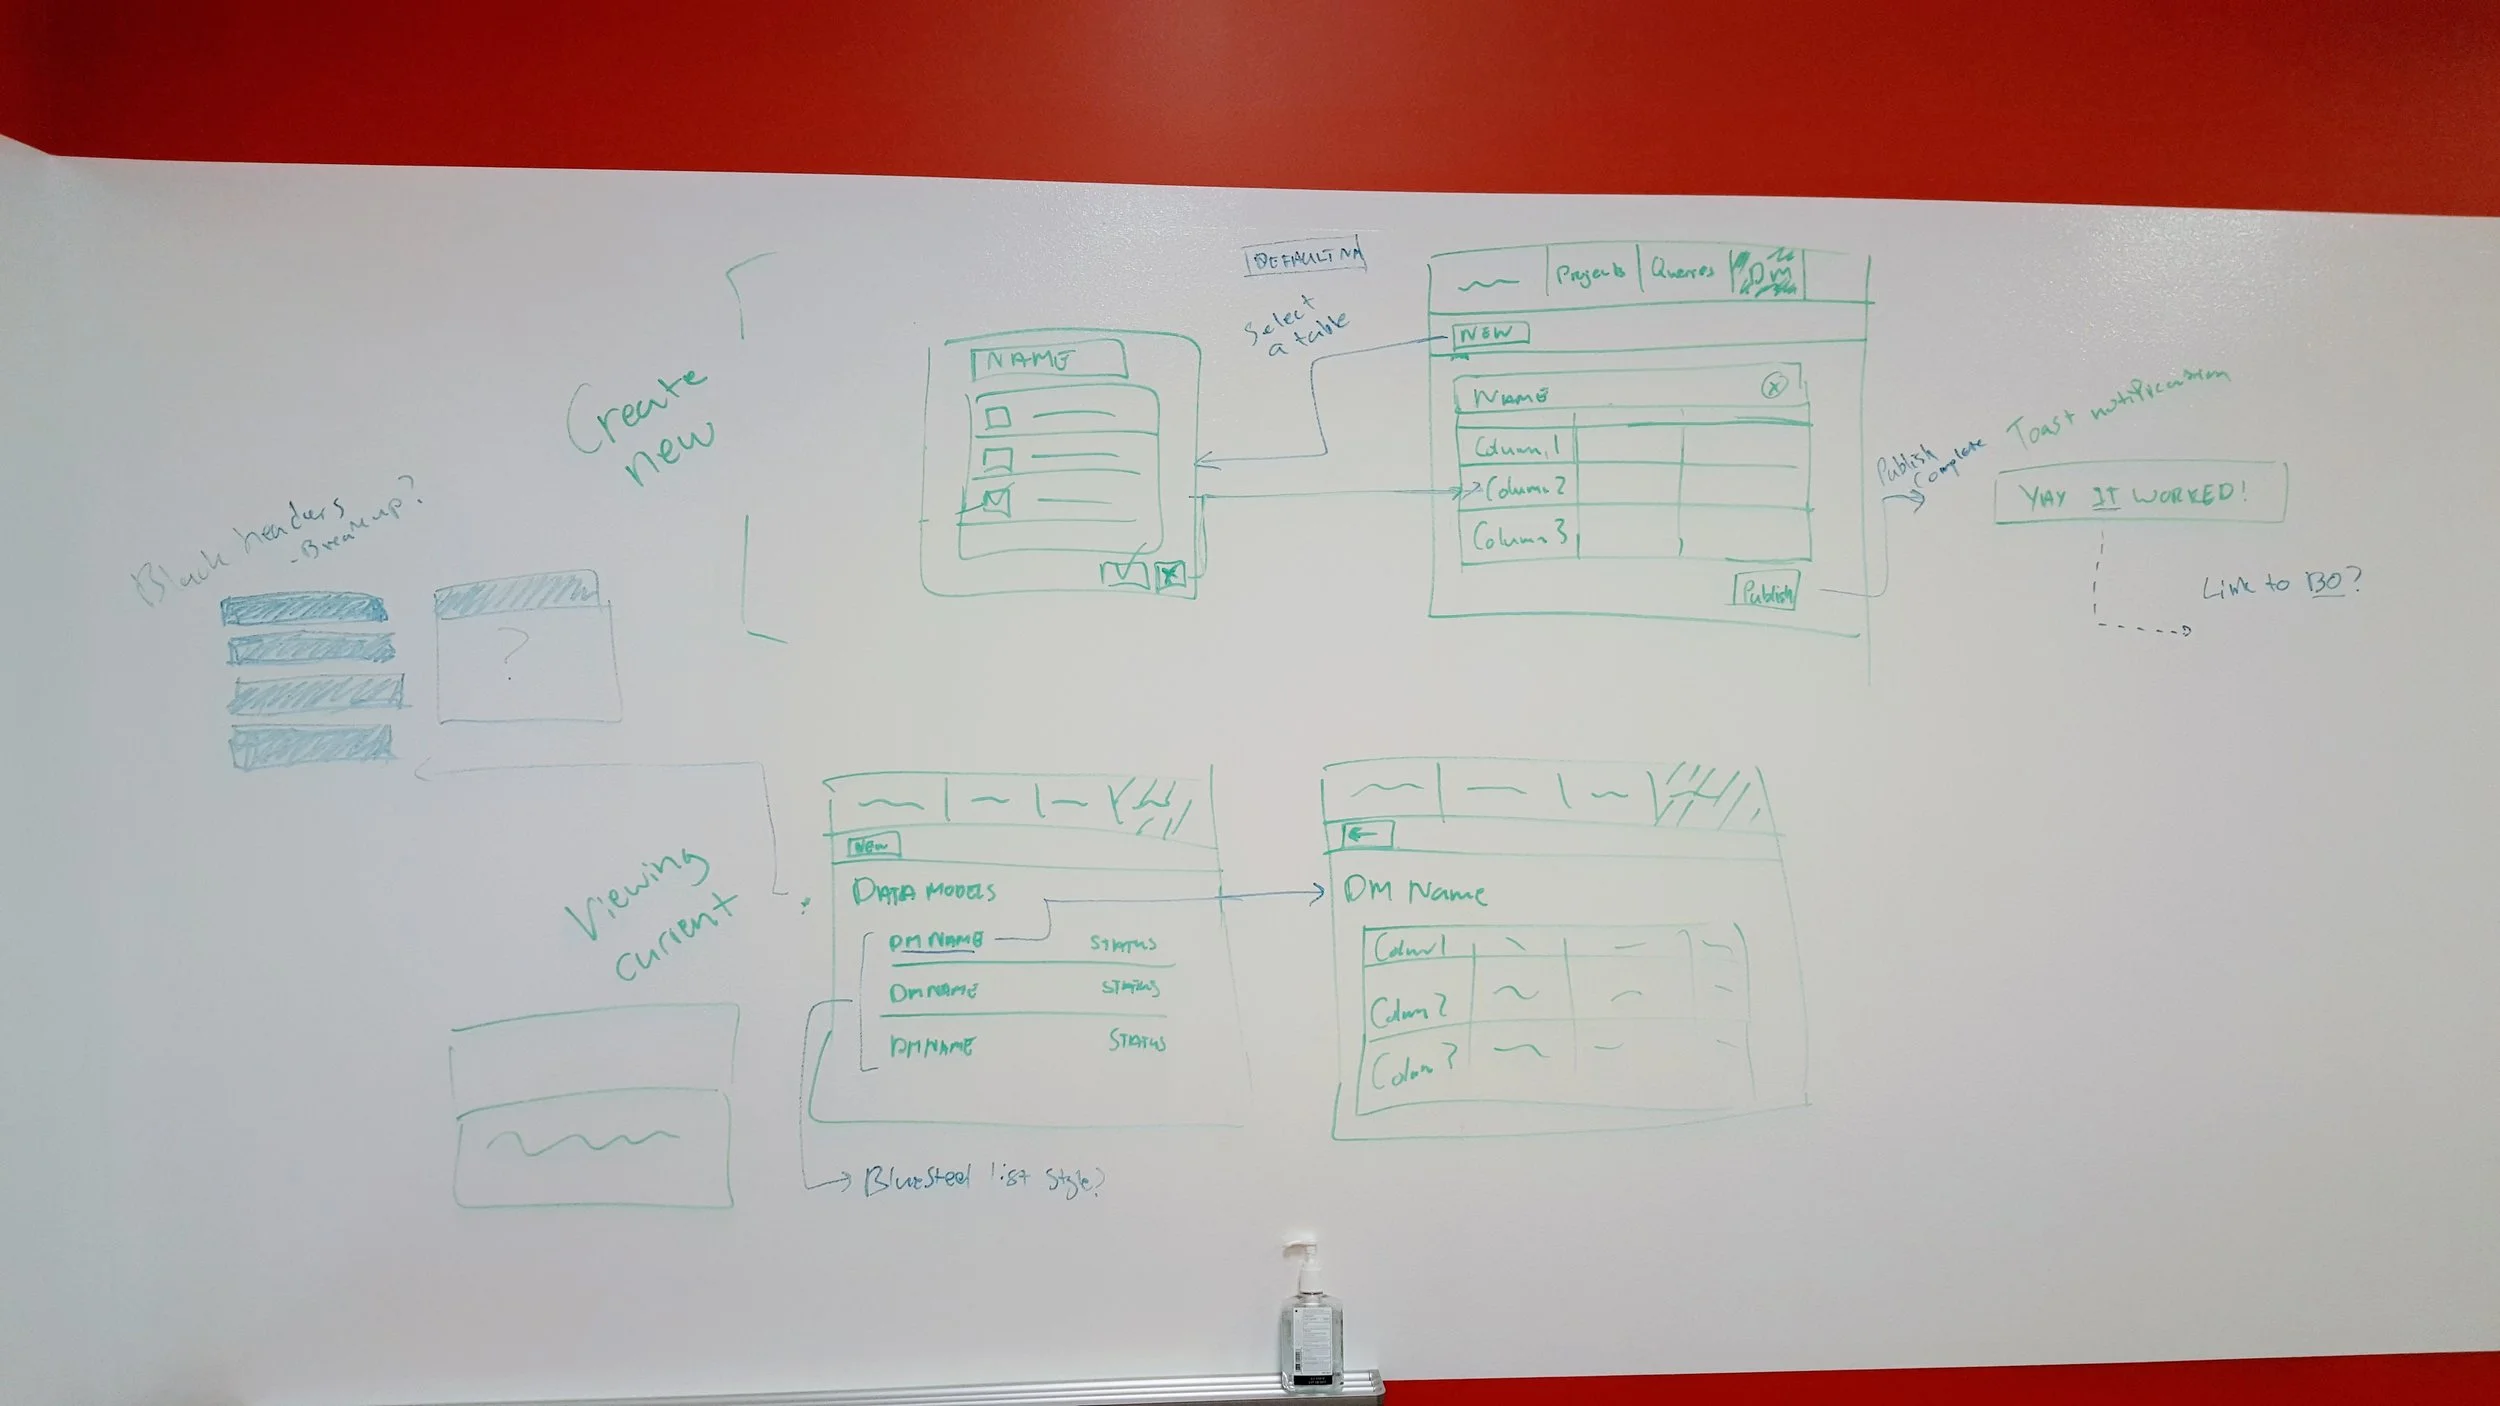
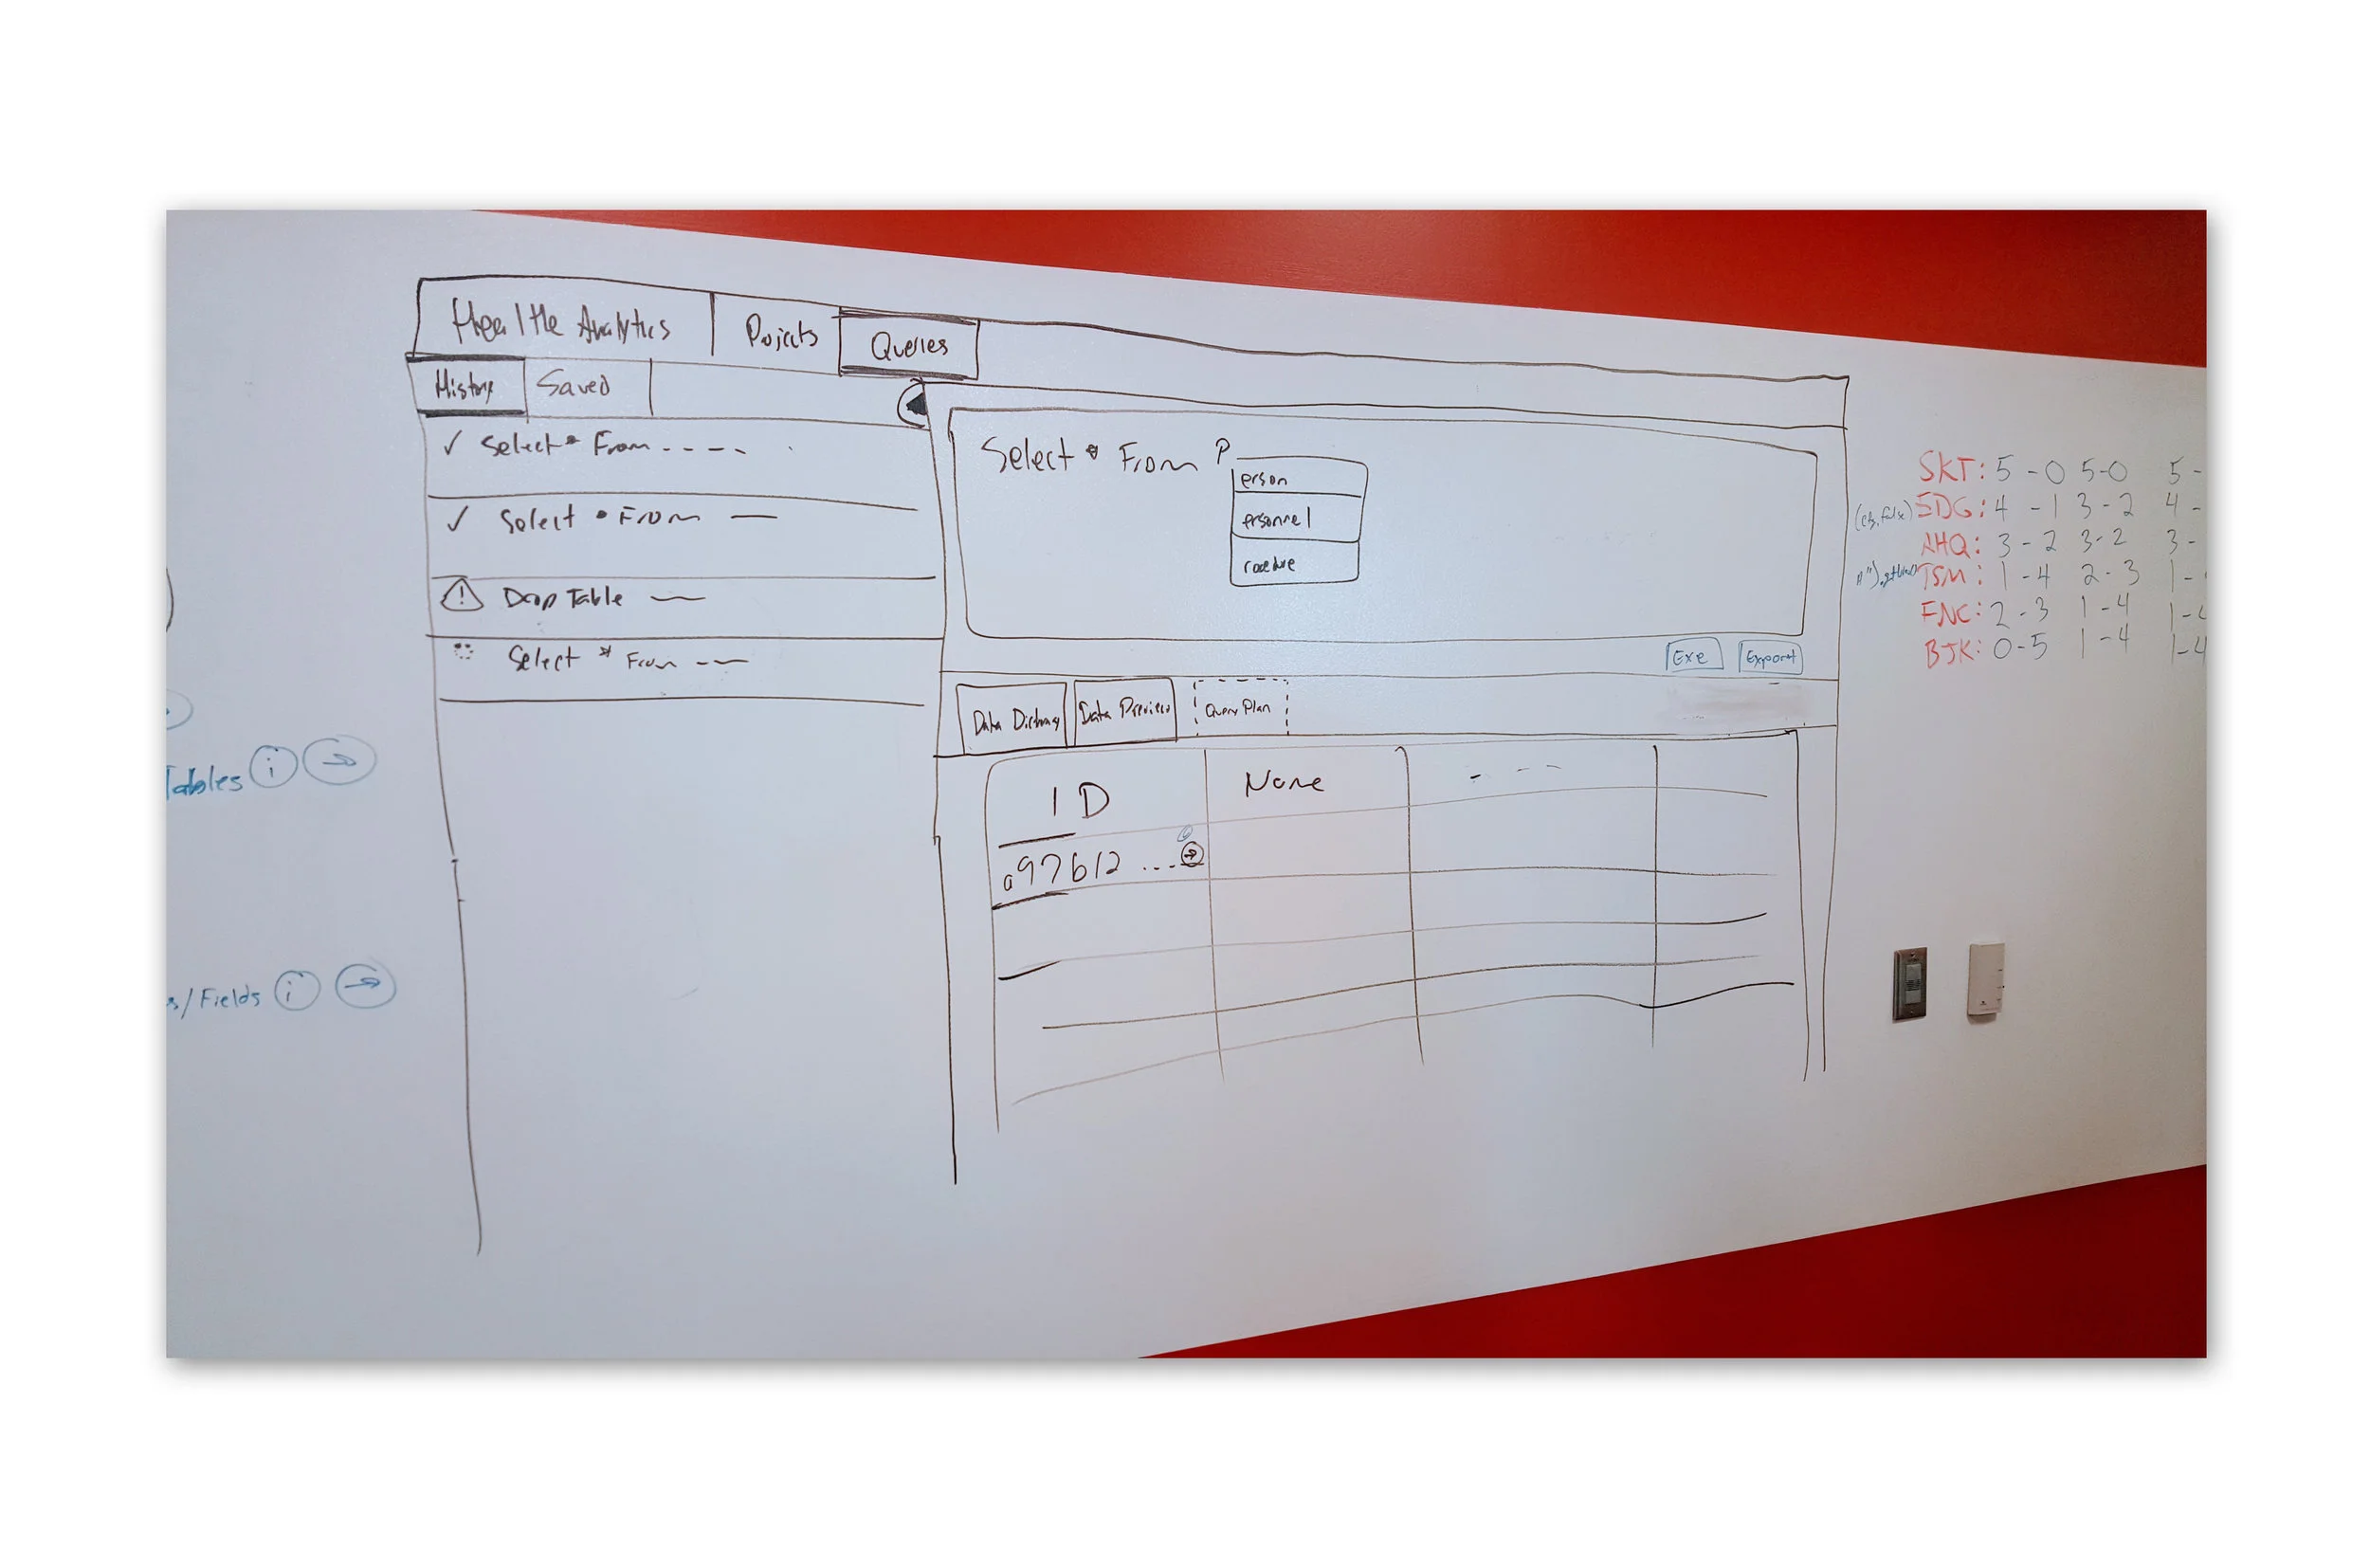
The first few weeks were spent in what we called “Art’s and Craft’s Mode” where we held long workshops to discuss workflows and then sketch ideas. We created a few persona cards to help keep us in context as we moved through the meetings.

Build
Following the Lean UX methodology of build - we did just that. In a number of weeks we went from whiteboard sketches to development in a staging environment. We moved quickly, just utilizing whiteboard sketches as deliverables. In rare cases we moved sketches into Balsamiq to produce prototypes for testing or client conversations. This gave us the opportunity to collect feedback from users along the way.


Measure & Learn
As we were working through designs we teamed up with researcher, Rachael Daniels, to conduct formative testing on what we produced. We were able to validate the direction on bigger questions like navigation schemes, and Project organization concepts. Additionally we also conducted Heuristic evaluations and usability reviews on released code to ensure a good steady pace of feedback was getting to the engineering team. The team utilized Splunk in order to track metrics and those were pulled into feature discussions and prioritized through a backlog grooming process.
Usability Testing Results
Usability Reviews
Chillmark’s Vendor Product Capabilities vs. Product Vision
successes and opportunities for improvement
In the end we achieved the goal of releasing the application on time. We landed a top spot on Chilmark’s Report for analytics tools and garnered some great client feedback.
During the process we discovered new ways of accessing user feedback. In this particular case we had internal users on the same floor as the development team, so we walked over and chatted with them about the application.
Snapshot from a video where we sat down with Data Stewarts on our floor
We also discovered that by designing at such a fast pace we relied more on intuition than on research/feedback. This led to discussions around integrating faster methods on engagement with research.


